
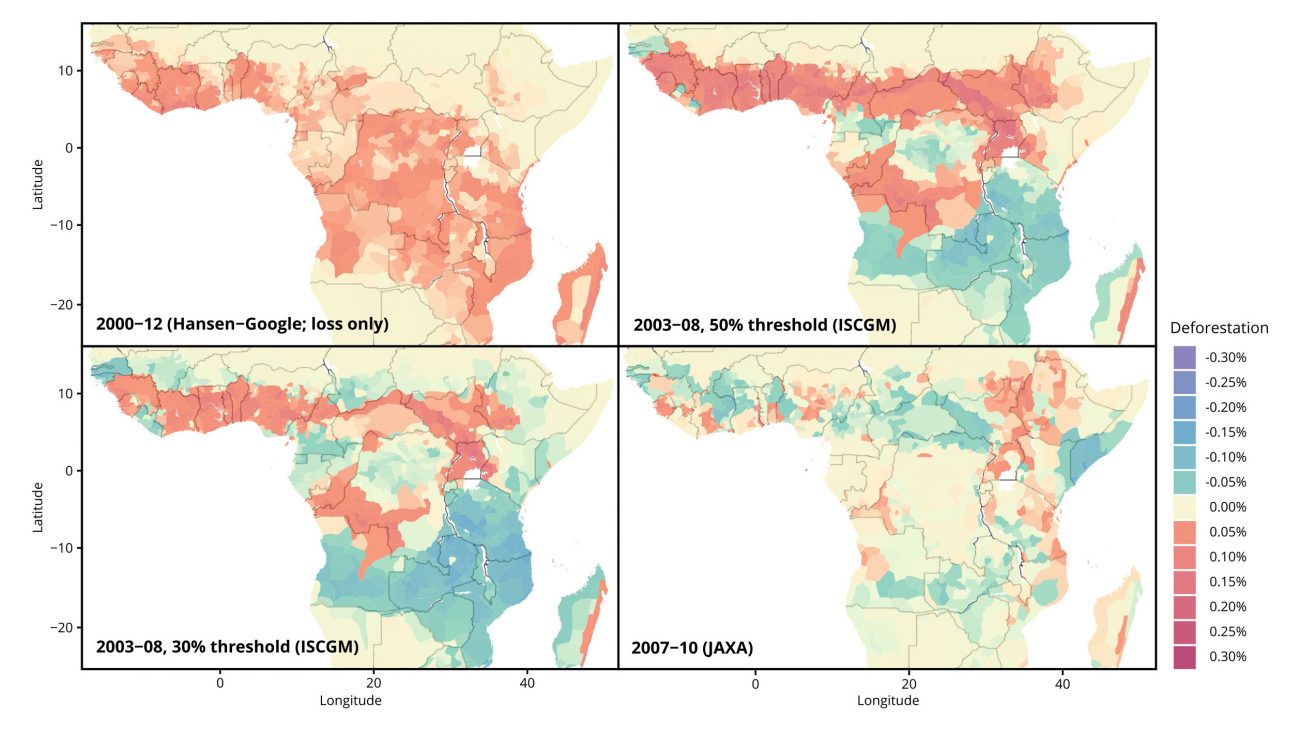
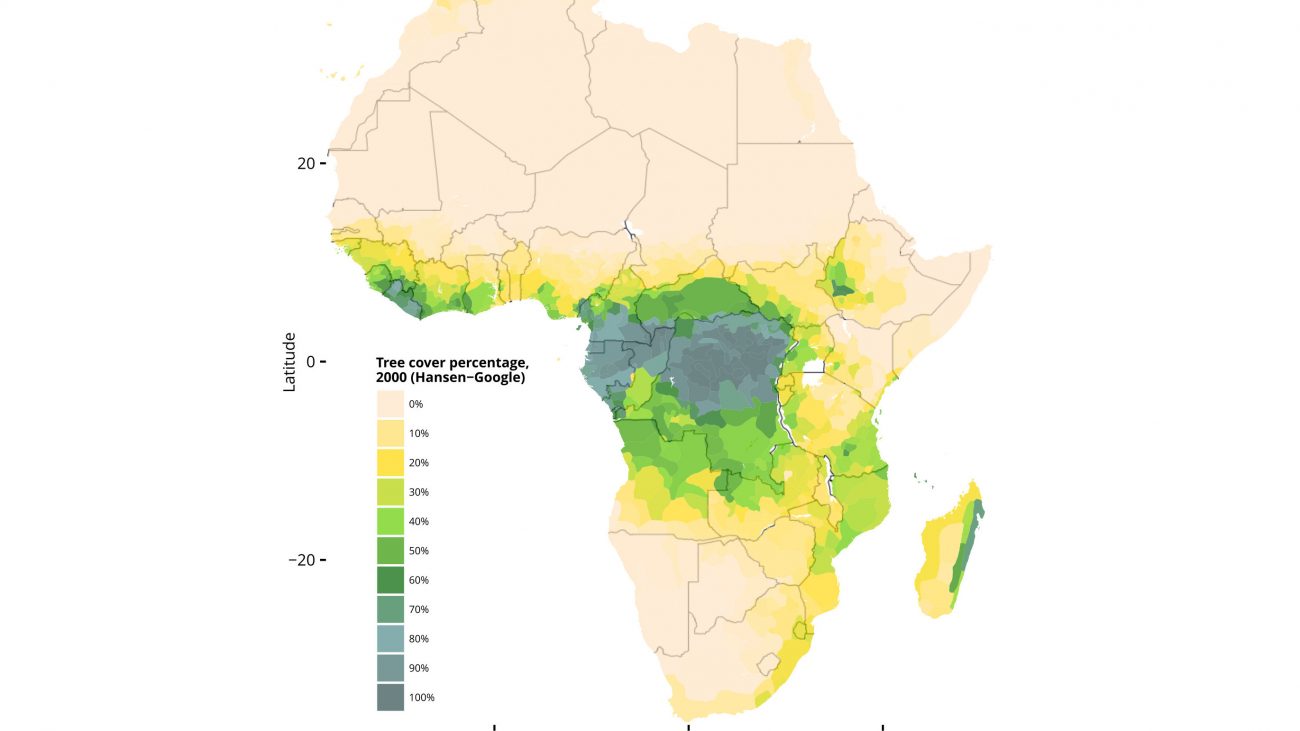
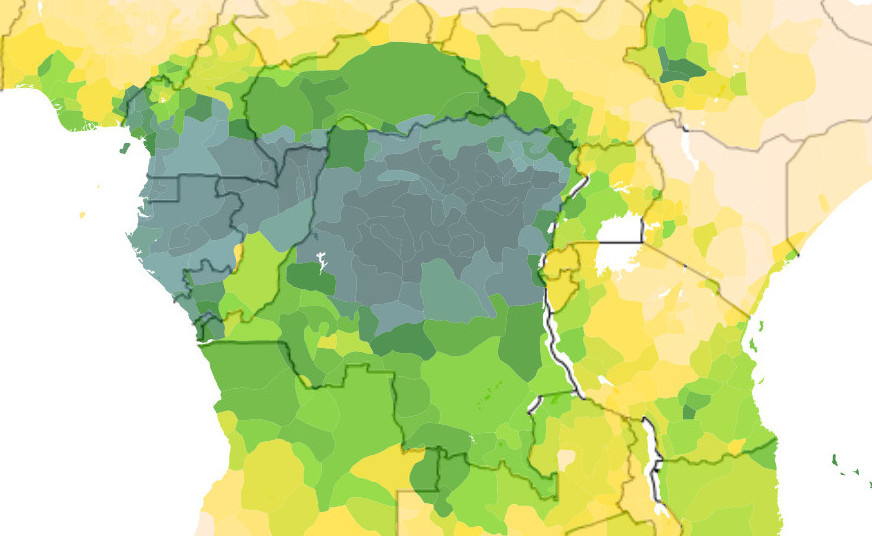
This is a series of maps representing data on recent forest cover and deforestation.
Deforestation rates are calculated for institutional units at the sub-national level. Specifically, the rates are by units of pre-colonial institutions.
I built the maps by using R statistical language, and fine-tuned the design (typography, linework, composition) by using Inkscape to edit the maps in vectorial format.
The data on deforestation is provided by Google-Earth Engine, ISCGM and JAXA. The data on institutions is from N. Nunn. 2016.